Skip to content

C-MAP Feature Guide

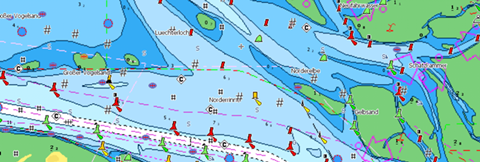
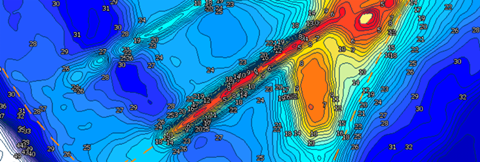
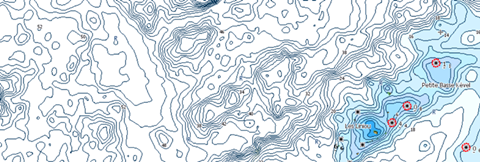
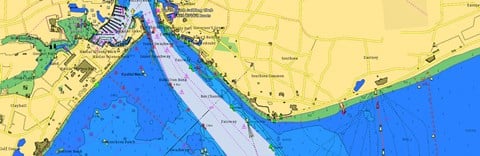
C-MAP charts are packed with features that bring crucial information and confidence to every trip out on the water. We've prepared this guide to highlight some of the features you get with C-MAP charts.

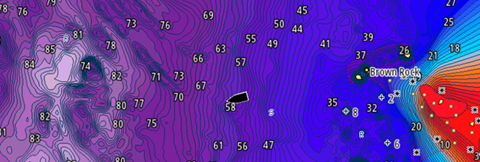
Note: Chart images are indicative of feature only and not available for all products or may not display exactly as pictured with all products.

WHAT'S THE DIFFERENCE BETWEEN RASTER AND VECTOR CHARTS?

MAX_N+Vector_770x260 (1).png
C-MAP’s powerful vector charts allow you to render the chart presentation suited for your specific needs – be it depth units in meters, rather than feet, or perhaps depth shading in hues of red and yellow, or turning off soundings over 40 feet, or even enlarging icons to make them more recognizable, the possibilities are endless!
Max-N+Raster_770x260.png
Raster charts provide that “old-school” feel of having a paper nautical chart at your disposal without the clutter at your helm. Where available, the raster chart layer provides full navigational information in the native presentation unique to the region and each Hydrographic Office.

COVERAGE

C-Map chart coverage comes in local, wide, mega-wide and continental formats bringing a range of details to your fingertips. The availability of each format will depend on the chart you select.

000-12074-001_01.jpg

Local

Local coverage charts provide advanced chart detail and feature-rich content. These large coverage areas meet the needs of many boaters: the perfect solution for the typical day sailor!
000-12058-001_1.png

Wide

Wide coverage charts give advanced chart detail and feature-rich content with larger coverage areas for far-ranging boaters and fishermen
61WroFj9ziL._AC_SL1000_.jpg

Mega Wide

Mega Wide - Only available for MAX - all the same features of a MAX Wide with twice the coverage!
000-13474-001_01.jpg

Continental

Less feature rich but a lot more coverage for the money! Provides full vector chart data, the high-res bathy layer and Easy Routing. Available in 4D and MAX-N+ only.